Bringing maintenance to life – How 3D visualization transforms plant operations
Picture this:
You’re a maintenance engineer standing in front of a vast industrial plant; kilometers of pipelines, thousands of valves, humming equipment everywhere. Suddenly, you get an alert that something’s wrong. A critical pressure transmitter is providing abnormal readings, triggering an alarm in the SCADA system.
But where is the transmitter?
Maybe it is located in a dense pipe rack with multiple similar instruments. Traditionally, finding that right asset means digging through drawings, P&ID’s, or maintenance records – and maybe spending half an hour just locating the right piece of equipment. In a plant where every minute of downtime can cost €100,000 per hour, “searching for it” isn’t exactly an ideal use of time.
Maintenance isn’t just about data – it’s about context
The truth is, most plants already have the data they need: condition monitoring system, maintenance system, ERP, technical documentations, SOP’s etc.. But the challenge isn’t the lack of information, it’s the fragmentation of it.
That’s where visualization changes the game. When maintenance engineers can see the data, where it lives, what it affects, and what needs attention, they can understand the problem faster and act more safely.
3D visualization turns maintenance from a guessing game into a guided experience. Instead of navigating through lists and tabs, engineers can explore a virtual model of the plant and instantly identify the affected area.
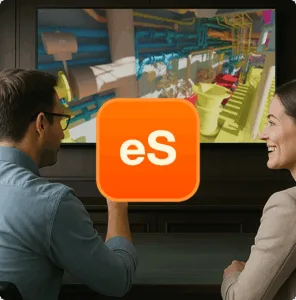
A visual layer that connects everything
Enter CADMATIC eShare, a digital twin platform designed to make complex plant environments easier to understand. Acting as a visualization layer, eShare integrates seamlessly with systems like IBM Maximo, connecting all relevant data, maintenance orders, sensors, documents, drawings, and placing them in a spatial, intuitive 3D environment.
Instead of switching between ten systems, users can explore a single visual interface. Need to plan a lockout-tagout procedure? eShare shows exactly which valves to close and in what order. Need to prepare for maintenance? You can “walk through” the site virtually, spotting potential hazards before anyone sets foot on the floor.
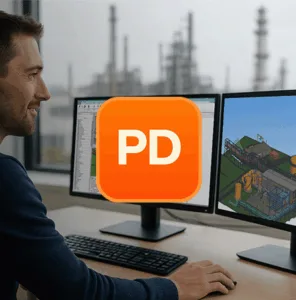
And since not every plant has a ready 3D model, eShare can also be used with P&IDs or laser-scanned point clouds, meaning even older facilities can be brought into the digital era quickly.

Training, collaboration, and confidence – all in one view
Visualization isn’t just for engineers. It’s transforming how teams learn and collaborate.
With eShare, teams can plan maintenance procedures, review risks, and practice safety steps using a digital twin. Subcontractors can familiarize themselves with the layout before arriving on-site. Planners can coordinate multiple teams across different plants – even across continents.
Imagine a global company with several power plants in different regions. Instead of traveling to plan a task, maintenance managers can now view the actual equipment, plan work, and verify conditions remotely.
The human impact: Turning complexity into confidence
3D visualization gives maintenance teams something they’ve long been missing: confidence.
Instead of wondering whether the information is up-to-date or whether they’re working on the right piece of equipment, they can trust what they see.
For many engineers, that means less time searching for answers and more time solving problems. For companies, it means fewer errors, safer work, and measurable efficiency gains.
When data becomes visible, maintenance becomes predictable. 3D visualization doesn’t just make operations easier to understand, it makes them smarter, safer, and faster.
Because sometimes, the best way to manage complexity… is simply to see it. Maintenance has entered the visual era.
→ Learn how CADMATIC eShare helps maintenance teams turn data into action.